
Innovations – Technical Advancements from BasketballScience.Net
Game Flow / Score Difference

Track Substitution Patterns in a Game

Substitution Patterns in a Game with Score Difference Superimposed

Game Flow / Score Difference – Determine scoring streaks by your team and by your opponent, and the implications.

This is how a Top 10 men’s college team (blue dots) was upset: the opponent (red dots) went on 3 streaks covering 6 minutes, for a 30-0 run, resulting in a 1-point victory for the underdog.
Improved Metrics – In addition to statistical totals and stats per game, we strongly endorse stats per 40 minutes (college) as a standardized, honest metric for player comparisons.

Possession Efficiency (Points per Possession) – Track by game against all opponents.

Team-Level Assessment – We create charts for optimal 5-Player Combinations: (a) Best Offense, (b) Best Defense, and (c) Best Overall Team in terms of Points per 40 minutes.

Game Participation – Who plays the most? Least?

Shooting Precision – Including Overall Shooting Percentage, a single metric for shooting precision across FTA, 2PA, and 3PA. Weighted and balanced by shot type.

Scoring Impact and Point Distribution – Who scores and how do they score?

Stat Totals

Stats Per 40 Minutes (College)

Stats Per Game

Rebounding Dominance and Rebound Distribution

Relationship of Game Tempo to Points per Possession – The blue team below has a decided speed advantage. Each dot represents a game played. Blue points are the “focus team” and orange dots are the opponent’s. Note that the “points per possession” (PPP) trendline increases dramatically for the blue team as the tempo increases. Thus, in a typical game, they can maximize their advantage (increase the score difference in a game) by picking up the pace.

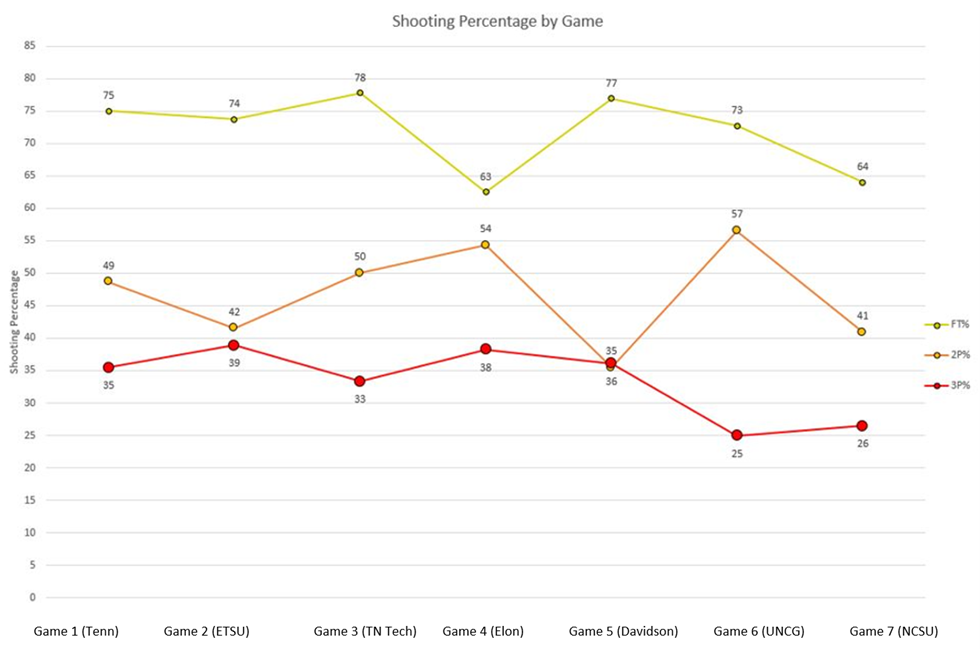
Tracking Shooting Percentage by Shot Type across Games
Possession Analysis: Possessions by Point Category (2 views: pie and bar)

Possession Analysis: How Possessions Ended (2 views: pie and bar)
